Pyinstrument
Great visual profiling library
installation
pip install Pyinstrument
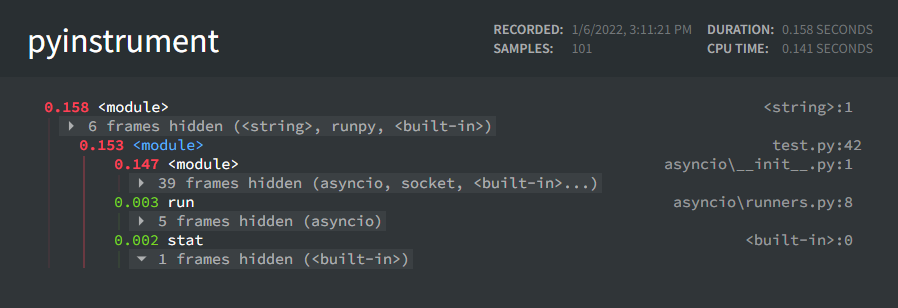
Get great output from testing
Pyinstrument -r 'html' -o output.html file.py
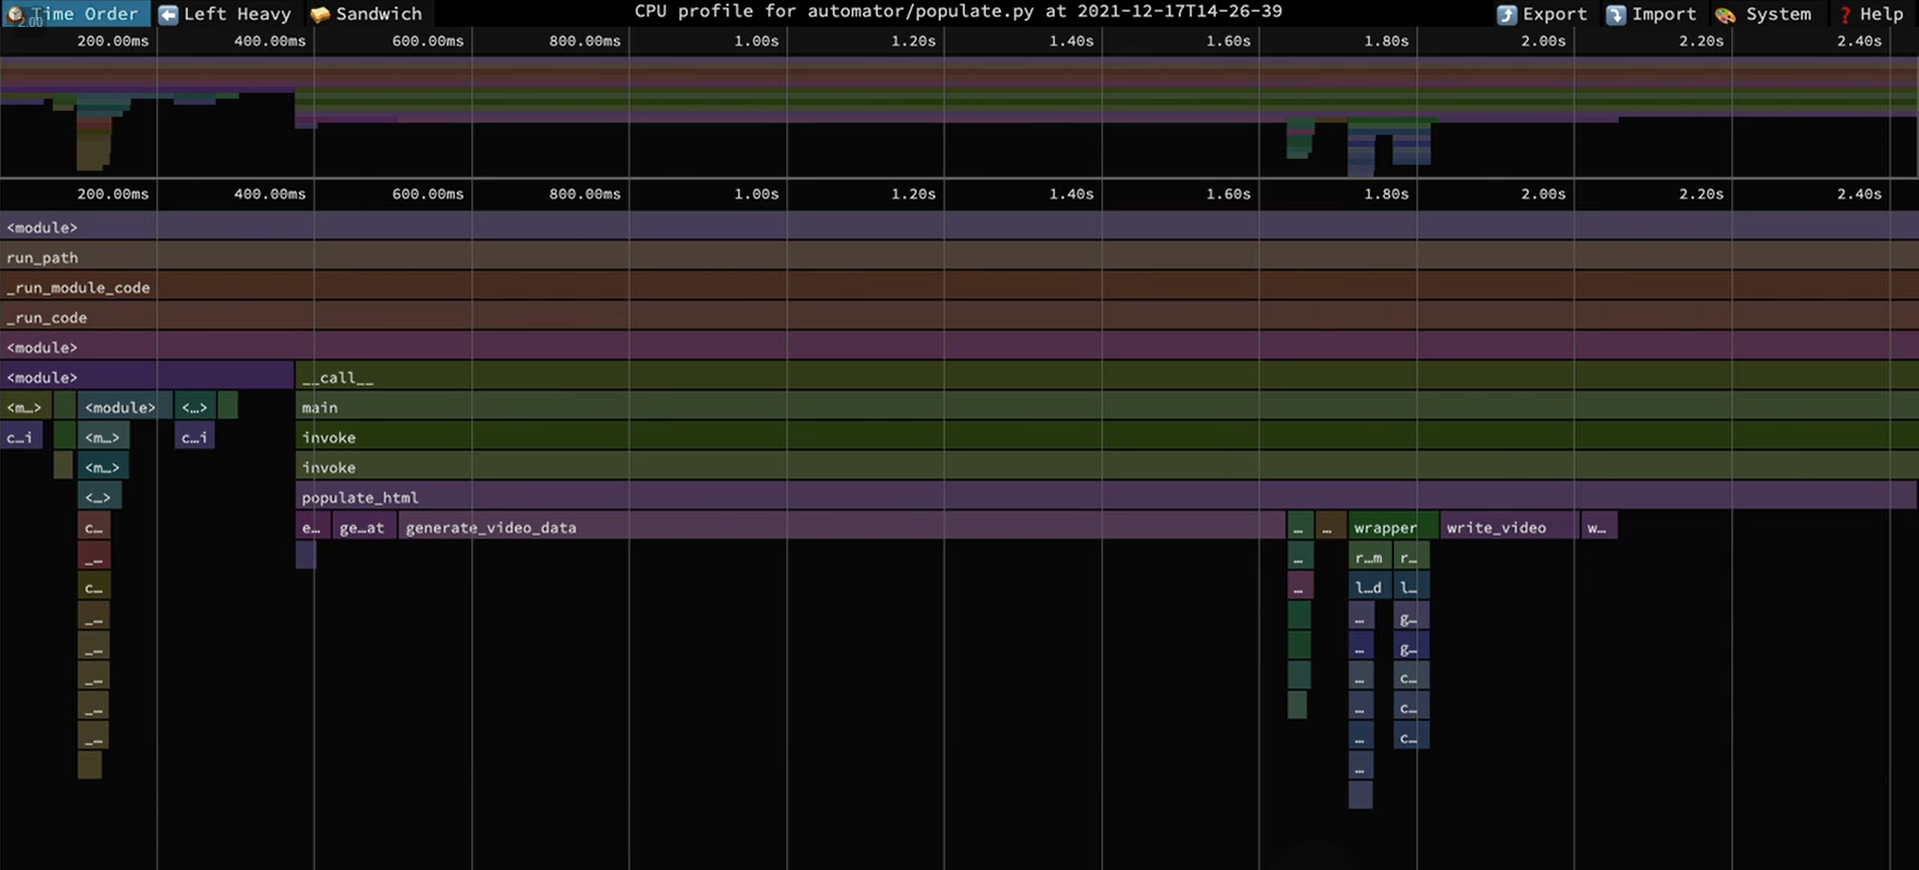
Get an interactive graphical flamegraph
pyinstrument -r speedscope -o speedscope.json path/script.py
Then open your Json file with https://www.speedscope.app/
running the profiler on inline code
using the function at the bottom profiler.open_in_browser() would be great if
passing a flag to a CLI program to enter into a testing/troubleshooting mode
import time
from pyinstrument import Profiler

# Note the interval value is 1/10th the sleeptime!
# This lets you change the speed graph intervals
# profiler = Profiler(interval=0.000001)

profiler = Profiler()
profiler.start()

sleep_time = 0.1

def start():
    time.sleep(sleep_time)
    do_sleep1()
    do_sleep2()

def do_sleep1():
    time.sleep(sleep_time)

def do_sleep2():
    do_sleep1()
    time.sleep(sleep_time)

start()

profiler.stop()
profiler.open_in_browser() # Several Options here